 FipLabs
FipWatcher - Analyze
Overview
The FipWatcher tab of FipLabs GUI allows to perform a diagnostic and analysis of your FIP network.
To use this mode, the requirement is to have a FipWatcher device from Exoligent installed on your local or on a remote machine.
This analysis can be refine with a network model creation using the FipDesigner tab. The combination of a FIP network model will allow you to make a more advanced and customized scan.
FipWatcher Binding
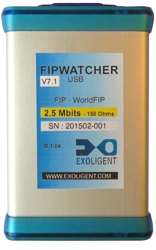
FipWatcher device is a small box suitable for a particular FIP speed. It is available for speeds: 31.25 Kbps, 1 Mbps and 2.5 Mbps.
It is composed of a FIP connector and an USB port. You can install it directly on your computer if you have a direct access to the FIP network to be analyzed.
Otherwise you can install it on a remote machine close to the FIP network and to access to the scanned FIP data via a TCP/IP connection and the FipLabs software.
Local Connection
Plug the FipWatcher device via USB on your local machine
If necessary, install dedicated driver from the Device Manager
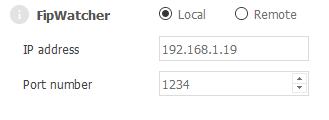
In the FipLabs app, please go to the FipWatcher tab → Parameters, and select the FipWatcher Local radio button.
It is now possible to run a scan if the FipWatcher device is connected to an active FIP network. To do this, please go to FipWatcher tab and click the Capture -> Start Capture button.
Remote Connection
Plug the FipWatcher device via USB on a remote machine
If necessary, install dedicated driver from the Device Manager (on the remote machine)
Register the FipWatcher with a correct FipLabs product key. (see FipWatcher Installation)
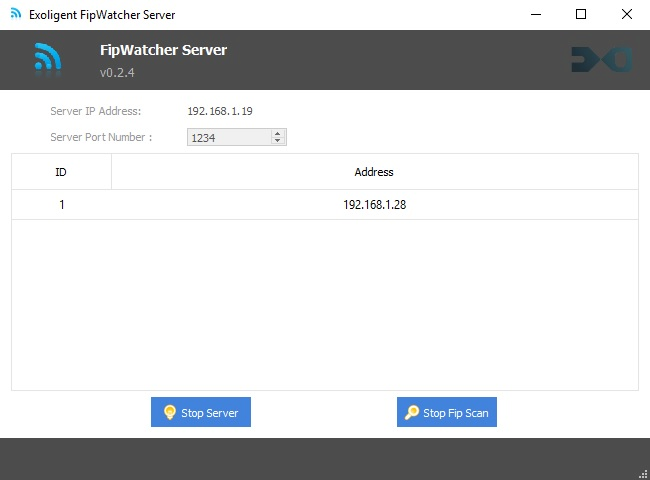
Launch the FipWatcher Server utility on the remote machine
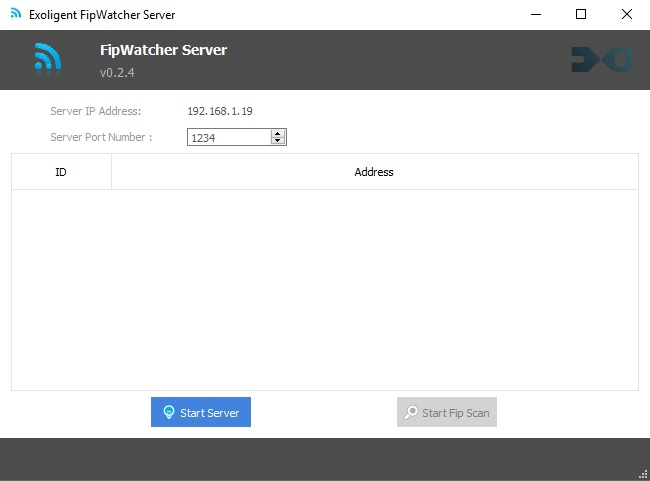
If the FipWatcher device is correctly installed, you could start the scan server by clicking on Start Server button.
If the FipWatcher device is connected to an active FIP network, click the Start Fip Scan button to launch the scan.
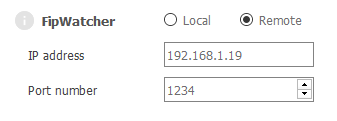
In the FipLabs application (installed on your local machine), please go to the FipWatcher → Parameters, and select the FipWatcher Remote radio button. Then fill in the IP address and port number corresponding to those set in the FipWatcher Server utility.
It is now possible to run a scan if the remote FipWatcher device is connected to an active FIP network. To do this, please go to FipWatcher tab and click the Capture -> Start Capture button.
NOTE: On establishing the remote connection, the FipWatcher Server utility will notify you a new client connection by adding a line in its table.
FIP Statistics
Overview
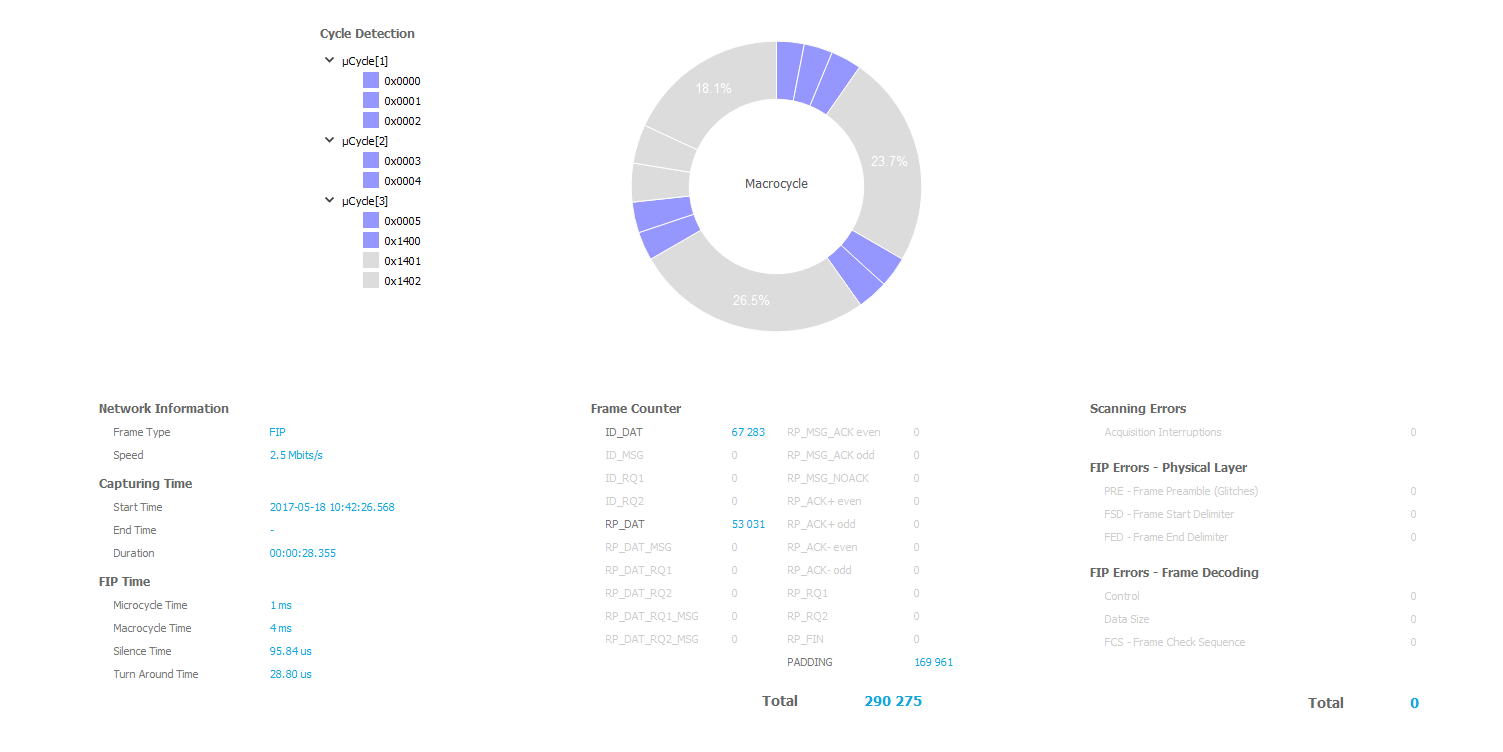
This page contains all the statistical indicators of the FIP network analysis.
Network information, frame counters, error counters and FIP times are displayed in this area.
A donut chart allows you to see easily the FIP macrocycle.
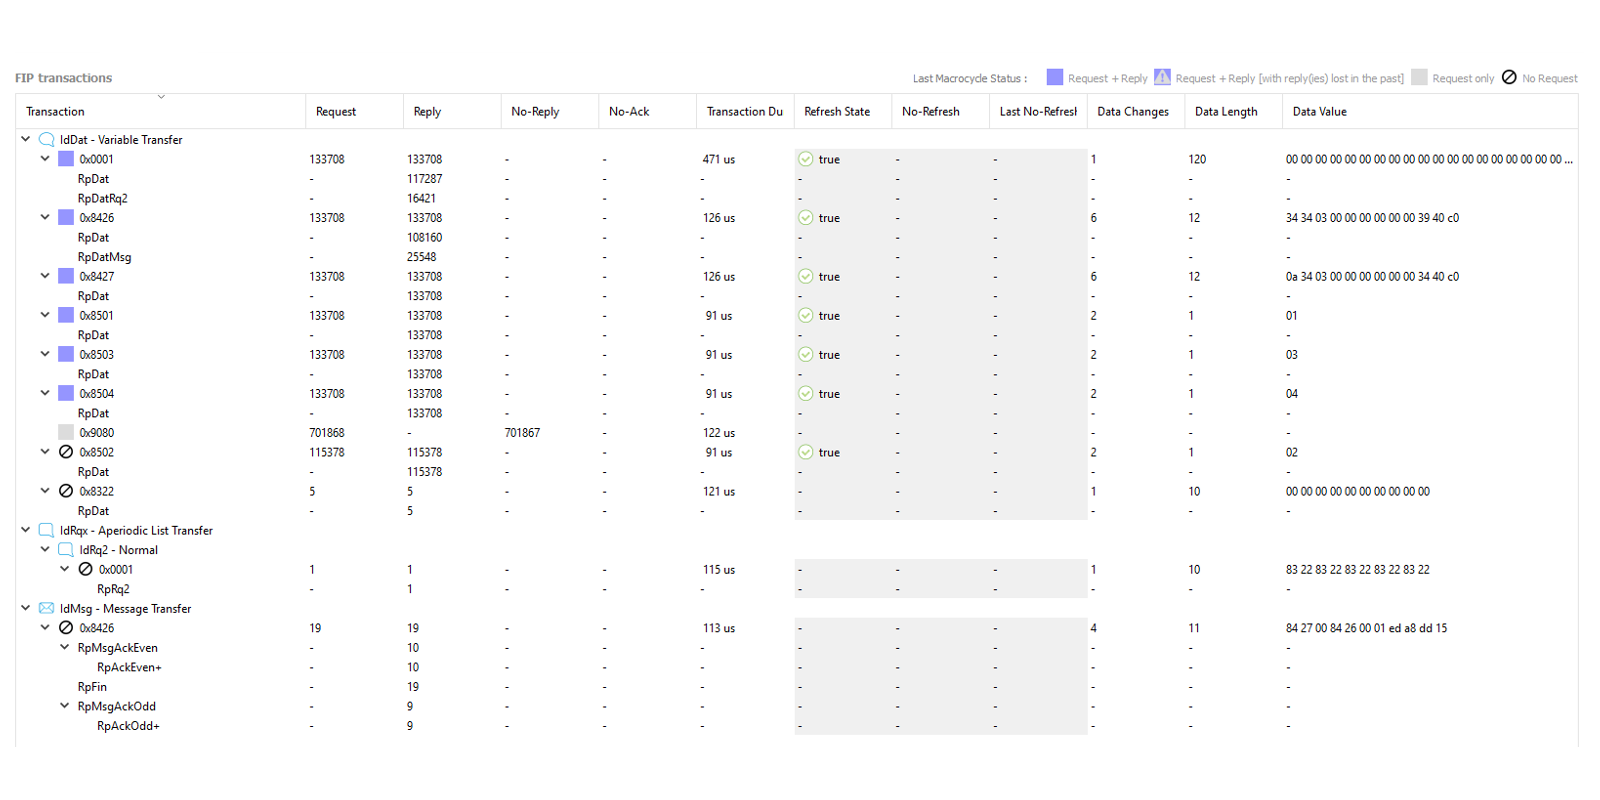
FIP transactions
Note: To Show/Hide a column, right-click on the FIP Transactions table header and select your favorite columns.
- Transaction
Type of FIP/WorldFIP transaction detected. This column categorizes transactions by type and ID number
- Request
Request counter for the transaction concerned
- Reply
Reply counter for the transaction concerned
- No-Reply
Unanswered request counter for the transaction concerned
- No-Ack
Unacknowledged request counter for the transaction concerned (significant only for message transaction with the acknowledgment activated)
- Glitches / 2s
This counter gives the number of corrected glitches in the current frame during the last 2 seconds.
- Max Jitter
This value indicates the maximum jitter encountered in the current frame. It is based on 1/50th bit for 31.25 Kbps, 1 Mbps, 2.5 Mbps and 5 Mbps bit rates, but 1/10th bit for the 25 Mbps bit rate.
- Transaction Duration
Transaction Duration in us.
For request with reply: Time = Request time + turnaround time + Reply time
For request without reply: Time = Request time + silence time - Refresh State
Status of the refresh flag for the transaction concerned
Note: This column is significant only if a "Design Model" (.labpro file) is loaded in FipDesigner tab. - No-Refresh
Number of transaction with the refresh flag lost
Note: This column is significant only if a "Design Model" (.labpro file) is loaded in FipDesigner tab. - Last No-Refresh
Last absolute date with the refresh flag lost
Note: This column is significant only if a "Design Model" (.labpro file) is loaded in FipDesigner tab. - Data Changes
Number of changes in frame value since the start of the acquisition
- Data Length
Length of useful data for the transaction concerned
- Data Value
Value of useful data for the transaction concerned
Main Informations
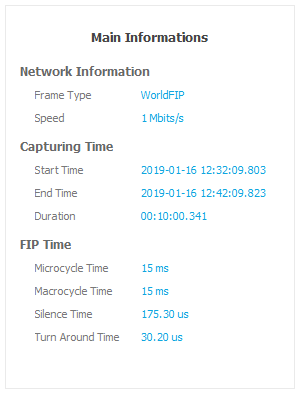
Network Information
- Frame Type
FIP, WorldFIP
- Speed
31.25 Kbps, 1 Mbps, 2.5 Mbps
Capturing Time
This part includes the time associated with the analysis:
- Start Time
Analysis Start Date.
- End Time
Analysis Stop Date.
- Duration
Time Capture.
FIP Time
This part includes the FIP network time:
- Microcycle Time
Total time of the elementary FIP cycle (subpattern of the macrocycle).
- Macrocycle Time
Total time of the main FIP cycle.
- Silence Time
Average of all the inter-frame counters of the padding ID.
- Turn Around Time
Average of all the inter-frame counters of the RP_DAT received.
Error Counters
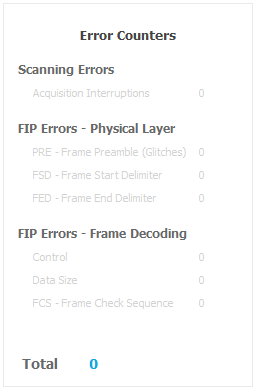
Scanning Errors
Acquisition Interruptions
This counter indicates the acquisition interruptions related to your computer activity. To avoid this problem, do not run CPU-intensive parallel tasks. If the problem persists, contact us !
FIP Errors
Physical Layer
This part contains frame detection errors related to the physical layer. These errors represents potentially frames missed by the FipWatcher device. Nevertheless it often indicates a noise on the FIP line.
- PRE – Frame Preamble (Glitches)
Frame preamble unknown
- FSD – Frame Start Delimiter
Frame start delimiter unknown
- PRE – Frame Preamble (Glitches)
Frame Decoding
This part contains frame decoding errors.
- Control
The first byte of the frame doesn't correspond to a known FIP control byte.
- Data Size
The length of the acquired frame doesn't match with the FIP control byte type or with the frame length byte announced.
- FCS – Frame Check Sequence
The FCS calculated from the data of acquired frame doesn't match with the read FCS.
- Control
Frame Counters
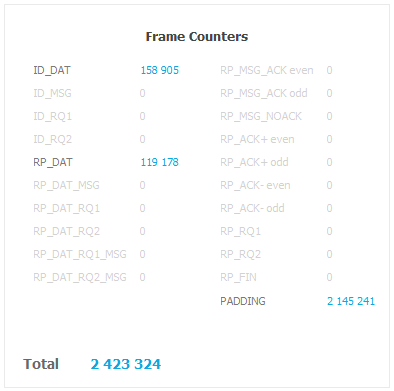
This part displays the frame counters. There is a counter by type of FIP control byte. Let's describe these counters:
- ID_DAT
Variable transfer request.
- ID_MSG
Message transfer request.
- ID_RQ1
Urgent aperiodic list transfer request.
- ID_RQ2
Normal aperiodic list transfer request.
- RP_DAT
Variable response.
- RP_DAT_MSG
Variable response with message request.
- RP_DAT_RQ1
Variable response with urgent aperiodic request.
- RP_DAT_RQ2
Variable response with normal aperiodic request.
- RP_DAT_RQ1_MSG
Variable response with message and urgent aperiodic request.
- RP_DAT_RQ2_MSG
Variable response with message and normal aperiodic request.
- RP_MSG_ACK even
Message response with acknowledgment request (reported even).
- RP_MSG_ACK odd
Message response with acknowledgment request (reported odd).
- RP_MSG_NOACK
Message response without acknowledgment request.
- RP_ACK+ even
Positive message acknowledgment (reported even). Message is stored in memory of the destination FIP device.
- RP_ACK+ odd
Positive message acknowledgment (reported odd). Message is stored in memory of the destination FIP device.
- RP_ACK- even
Negative message acknowledgment (reported even). Due to lack of available resources in destination FIP device, the message is not stored in its memory.
- RP_ACK- odd
Negative message acknowledgment (reported odd). Due to lack of available resources in destination FIP device, the message is not stored in its memory.
- RP_RQ1
Response containing a list of urgent aperiodic requests.
- RP_RQ2
Response containing a list of normal aperiodic requests.
- RP_FIN
End of message transaction.
- PADDING
Padding frames inserted by the bus arbiter. This frame ID may change depending on the network being analyzed. To set its value, go to FipWatcher -> Parameters - Padding.
Transaction Counters
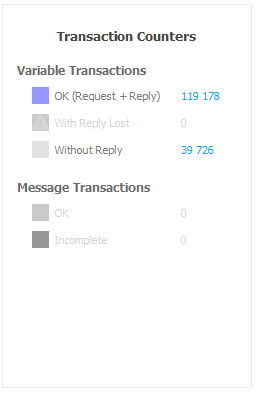
Variable Transactions
OK (Request + Reply)
This counter indicates the number of full variable transactions
With Reply Lost
This counter indicates the number of instable transactions. It's a hybrid counter; it indicates the number of transactions without response (ID_DAT only) for a transaction that has already been answered (ID_DAT + RP_DAT) during the analysis.
Without Reply
This counter indicates the number of transactions that never received a reply during the analysis.
Message Transactions
OK
This counter indicates the number of full message transactions.
Incomplete
This counter indicates the number of incomplete message transactions.
Network Ratio
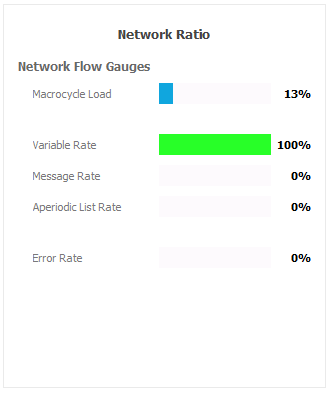
Network Flow Gauges
Macrocycle Load
Useful frames percent (versus padding frames).
Variable Rate
Variable frames rate inside useful traffic. Frames concerned are:
- ID_DAT
- RP_DAT
- RP_DAT_MSG
- RP_DAT_RQ1
- RP_DAT_RQ2
- RP_DAT_RQ1_MSG
- RP_DAT_RQ2_MSG
Message Rate
Message frames rate inside useful traffic. Frames concerned are:
- ID_MSG
- RP_MSG_ACK even
- RP_MSG_ACK odd
- RP_MSG_NOACK
- RP_ACK+ even
- RP_ACK+ odd
- RP_ACK- even
- RP_ACK- odd
- RP_FIN
Aperiodic List Rate
Aperiodic lists frames rate inside useful traffic. Frames concerned are:
- ID_RQ1
- ID_RQ2
- RP_RQ1
- RP_RQ2
Error Rate
Erroneous frames percent.
FIP Trace
This page contains all the FIP frames captured by the FipWatcher device. Each FIP frame is dated and presented in a table row.
NOTE: You can easily filter the frame received according various modes as needed. To do this go to:
FipWatcher tab → Parameters → Visual FIP Trace Depth
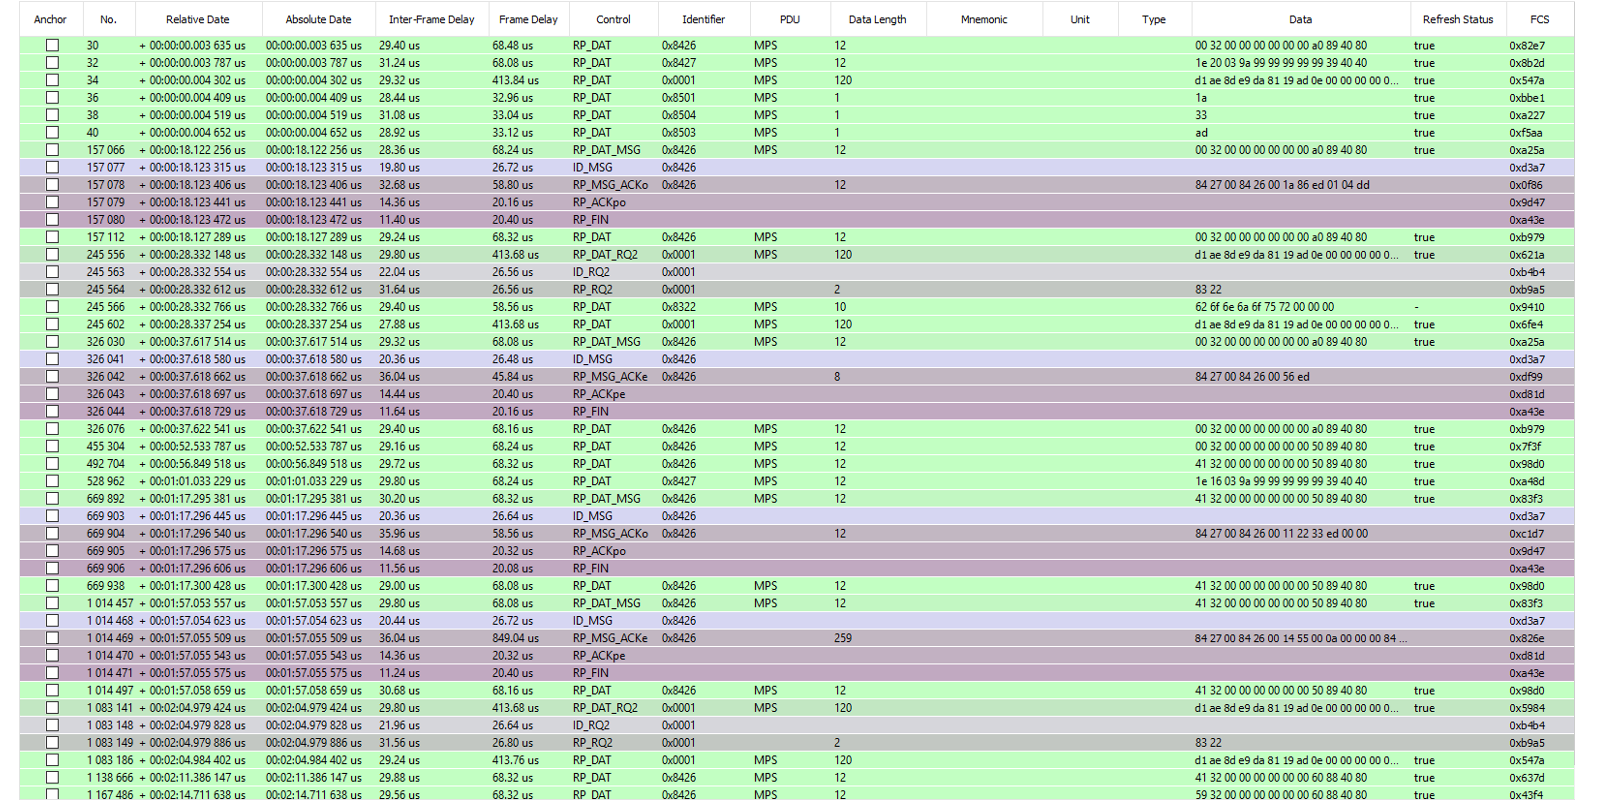
Here we will define the different values of the table:
- Anchor
This field is composed of a check-box. The user can check the box only when the FIP capturing is stopped. Moreover all the anchors check-boxes are auto-exclusive (ie one box can be checked at a time). The box checked becomes the reference time to calculate the Relative Date column.
- No.
This field is the number of the frame since the start of acquisition.
- Relative Date
The relative date field is calculated using the anchor reference.
- Absolute Date
The absolute date field is the date of appearance of the frame from the beginning of the acquisition.
- Inter-Frame Delay
This field is the time (expressed in microseconds) between the end of the previous frame and the beginning of the current frame.
- Frame Delay
This field is the time (expressed in microseconds) between the start and end of the current frame.
- Control
This field is the decoding of the FIP control byte.
- Identifier
This field is the decoding of the FIP identifier word (16-bits).
- PDU
This field is the decoding of the FIP PDU byte.
- Data Length
Length of the useful FIP data detected.
- Mnemonic
Mnemonic Name.
- Data
Useful FIP data bytes detected.
- Description
Mnemonic description.
- Type
Mnemonic data format.
- Bit Range
Bit range of the mnemonic in the FIP frame.
- Production Status
This field is a true/false flag that informs whether the frame carries a production status byte. This information must be mentioned by the user via the network model (FipDesigner tab).
- Meaning Status
If the Production Status has to be interpreted (ie Production Station flag is true), the last useful FIP data byte of the frame will be treated as a production status byte. The Meaning Status set to true means that the variable was written at least once in the user database of the FIP device.
- Refresh Status
If the Production Status has to be interpreted (ie Production Station flag is true), the last useful FIP data byte of the frame will be treated as a production status byte. The Refresh Status set to true means that the variable was produced in a period called production period. This flag is significant only if Meaning Status is set to true.
- FCS
This field is the decoding of the frame check sequence word (16-bits).
Macro - Microcycles
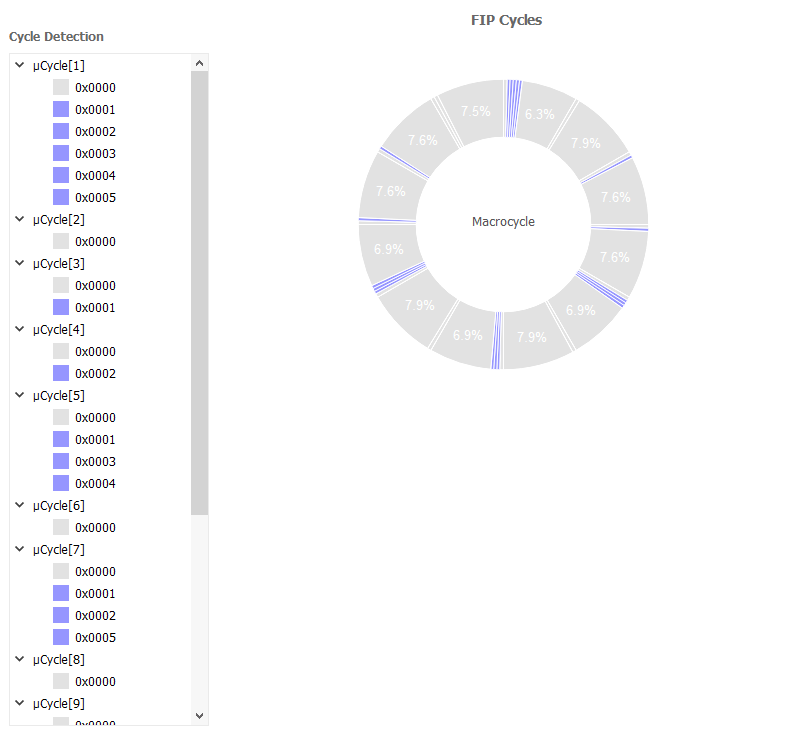
During the polling, the FIP macrocycle is automatically calculated and displayed. The order of elements detected is clockwise. Only periodic elements are represented (ie ID_DAT, ID_MSG).
The detection of an ID_DAT with its RP_DAT answer is represented with a blue colored element.
If there is only an ID_DAT detection, the macrocycle element is grayed.
The Cycle Detection widget textually displays the complete macrocycle and its substructures (microcycles).
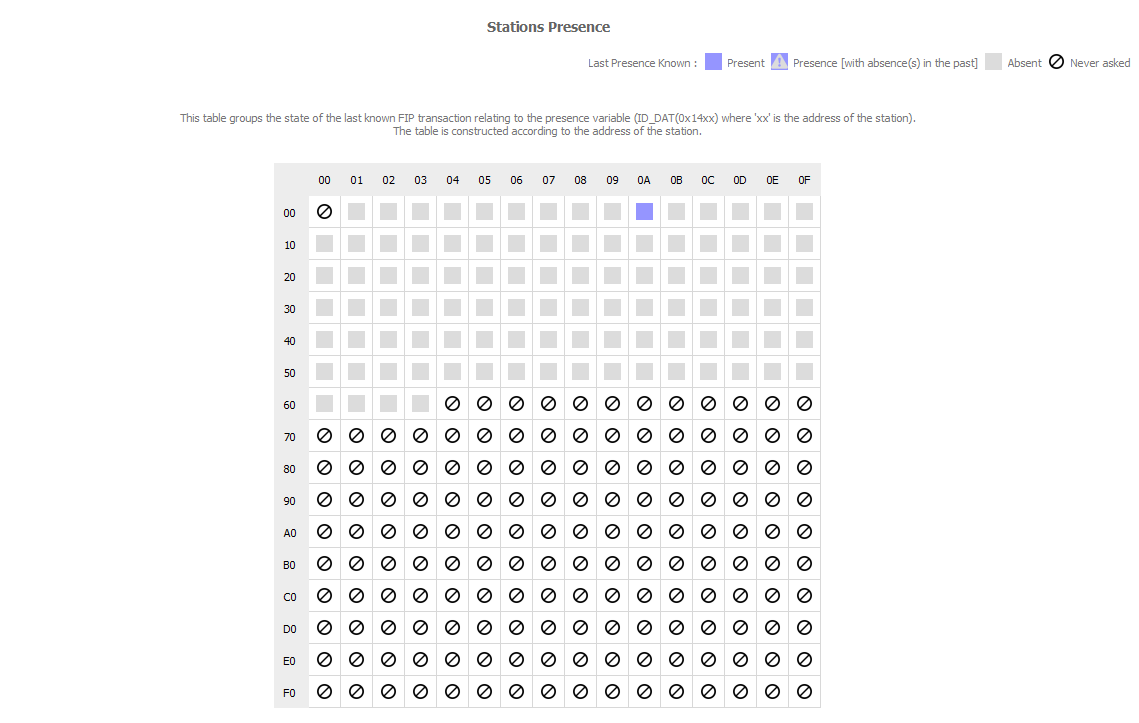
Station Presence
This page contains all the responses to the FIP presence identifier [ie ID(0x14xx) where 'xx' is the address of the FIP station].
Mnemonics
NOTE: This mode is available only if your FipWatcher is registered for FipLabs. See Registration.
Mnemonics Statistics
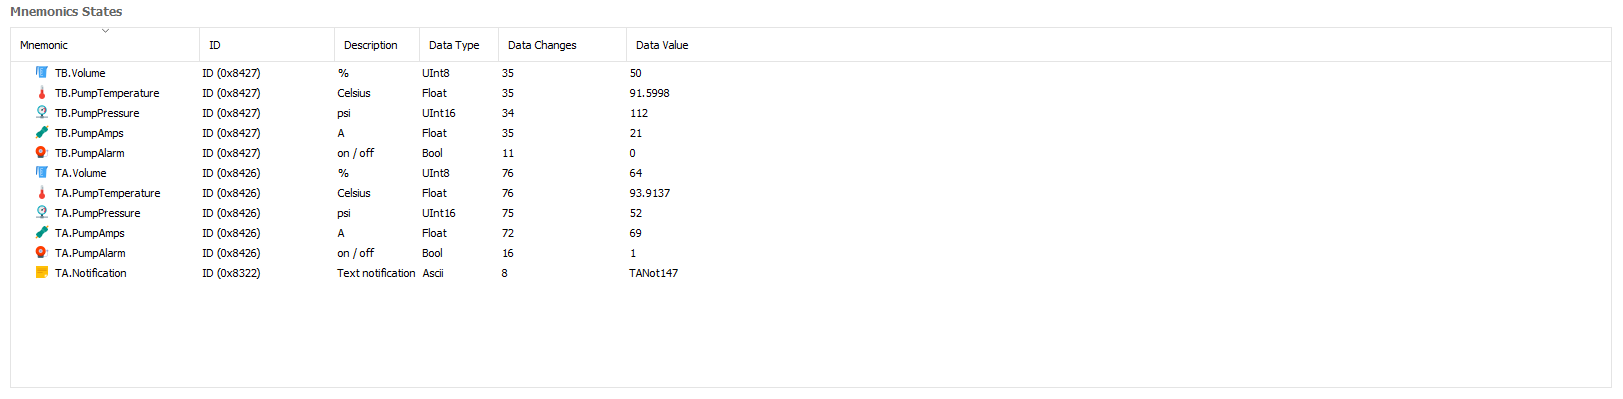
Note: To Show/Hide a column, right-click on the Mnemonics States table header and select your favorite columns.
In the same way as for transactions statistics, you can follow the live mnemonic data here.
- Mnemonic
Tag name
- ID
FIP variable identifier attached
- Endianness
Byte order in the FIP frame
- Description
Description or unit of the mnemonic value
- Start Bit
Start bit position of the mnemonic value in the FIP frame
- Stop Bit
Stop bit position of the mnemonic value in the FIP frame
- Byte Size
Number of bytes for the value
- Data Type
Type of data (Ascii, Bool, Float, Hexa, Int8, Int16, Int32, Int64, UInt8, UInt16, UInt32, UInt64)
- Data Changes
Number of changes in value since the start of the acquisition
- Data Value
Mnemonic value
Mnemonics Line Charts
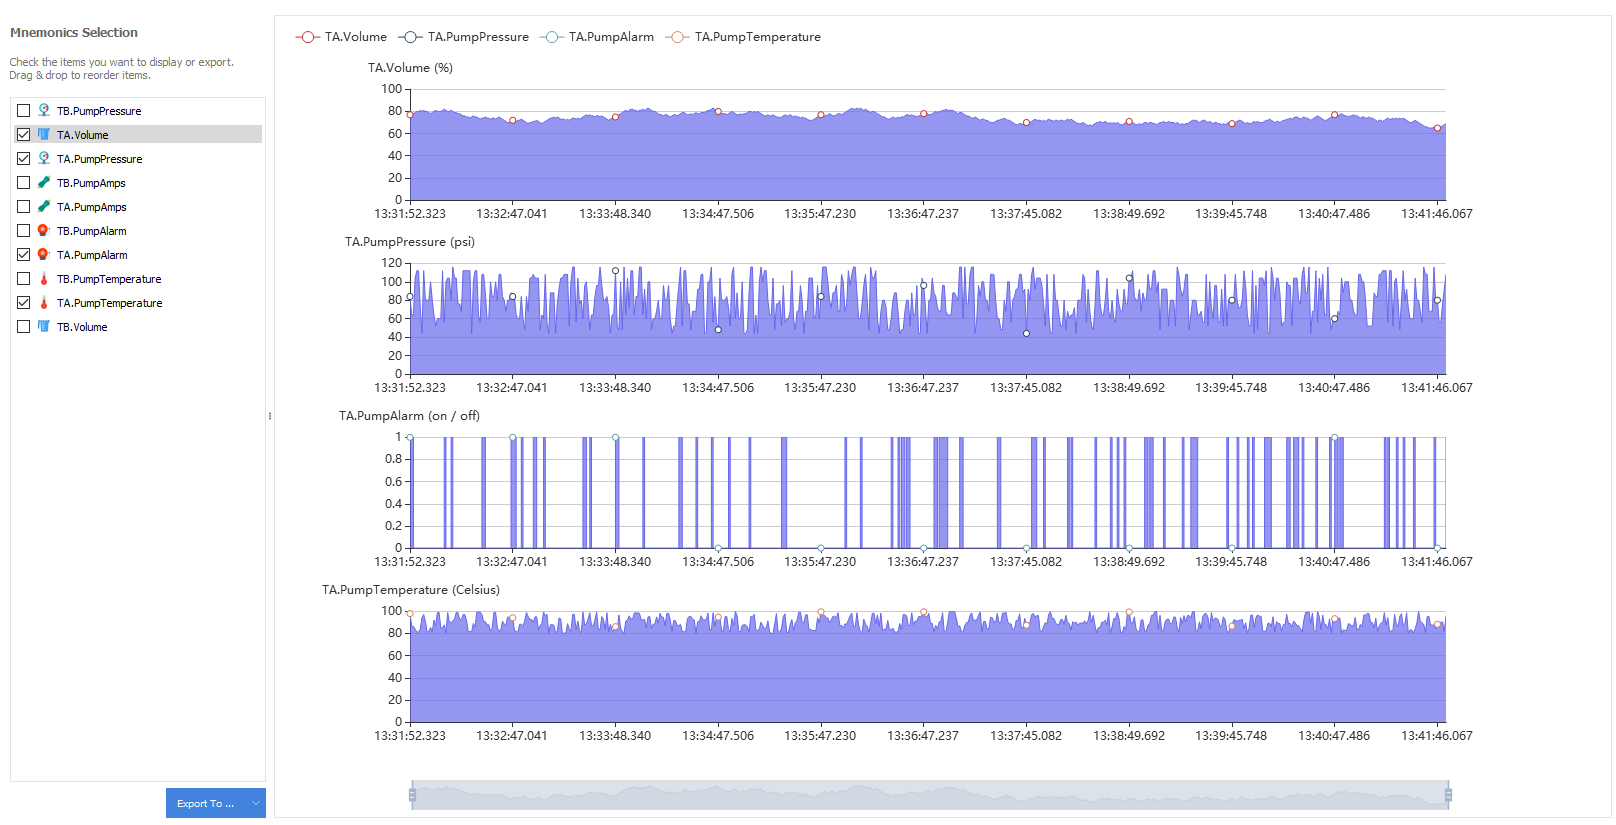
This section allows to visualize and to export the evolution of the mnemonic values to different formats: CSV, TSV, JSON.
Parameters
FipWatcher - Location
Local
When you have the option of directly accessing your FIP network from your local PC (ie your FipWatcher box is connected to your machine via the USB cable), select the radio button named "Local".
Remote
When your computer is away from your FIP network, it is possible to set up a remote connection using the "Remote" radio button. For more information, see section FipWatcher - Remote Connection.
FipWatcher - Oscilloscope Trigger
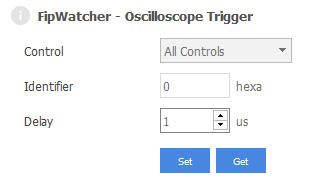
If your FipWatcher is equipped with an oscilloscope outlet, it's possible to generate a trigger signal from the FipLabs application. This signal thus makes it possible to trigger a FIP frame on the type of control and / or identifier that you want. The pulse width after detection can be set using the "Delay" option (in microseconds).
Control
- All Controls
The filter on the control type is disabled.
- ID_DAT
Variable transfer request.
- ID_MSG
Message transfer request.
- ID_RQ1
Urgent aperiodic list transfer request.
- ID_RQ2
Normal aperiodic list transfer request.
- RP_DAT
Variable response.
- RP_DAT_MSG
Variable response with message request.
- RP_DAT_RQ1
Variable response with urgent aperiodic request.
- RP_DAT_RQ2
Variable response with normal aperiodic request.
- RP_DAT_RQ1_MSG
Variable response with message and urgent aperiodic request.
- RP_DAT_RQ2_MSG
Variable response with message and normal aperiodic request.
- RP_MSG_ACKe
Message response with acknowledgment request (reported even).
- RP_MSG_ACKo
Message response with acknowledgment request (reported odd).
- RP_MSG_NOACK
Message response without acknowledgment request.
- RP_ACKpe
Positive message acknowledgment (reported even).
- RP_ACKpo
Positive message acknowledgment (reported odd).
- RP_ACKme
Negative message acknowledgment (reported even).
- RP_ACKmo
Negative message acknowledgment (reported odd).
- RP_RQ1
Response containing a list of urgent aperiodic requests.
- RP_RQ2
Response containing a list of normal aperiodic requests.
- RP_FIN
End of message transaction.
Identifier
Targeted FIP identifier (16-bit).
Delay
Duration of pulse after detection.
- 0
A FIP bit time.
- 1 to 65 535
Duration of trigger pulse (in us).
Raw Frames Color
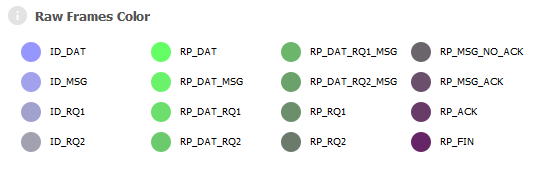
These colors allow you to quickly identify frames according to their FIP control byte type. These colors are used in the FIP Trace section.
Padding / Stuffing
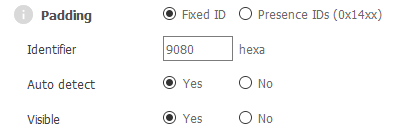
Type
The padding can be set using two options :
- Fixed ID
The bus arbiter produces a fixed padding frame. In this case, set its value into Identifier field.
- Presence IDs (0x14xx)
The bus arbiter produces a padding frame dynamically in the FIP identifier range [0x1400; 0x14FF].
Note : It is important to correctly define the stuffing frame for the reconstruction of the macrocycle.
Identifier
FIP identifier (ID_DAT - 16-bit) that is used as the padding frame for the macrocycle.
Auto detect
If the fixed padding set by the user is not detected during the analysis, an algorithm tries to determine the padding frame by itself.
Visible
This option makes it possible to make visible or not the padding frame in the FIP Trace section.
Macrocycle
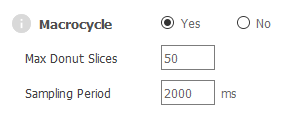
The Macrocycle frame is an option to detect and display the macrocycle into the Macro - Microcycles section.
Note : In case of macrocycle detection problems, it is recommended to disable this option to avoid GUI slowdowns.
Max Donut Slices
Maximum slices (slices = FIP Identifiers) displayable into the donut chart (Macro - Microcycles section).
Note : If the maximum slices number has been reached, but microcycles have been detected within the macrocycle, the display will be in a degraded mode (then slices = Microcycles). If the number of microcycles is still too large for the display, then the donut chart is hidden.
Sampling Period
This time in milliseconds is a sampling period of the FIP traffic used for macrocycle reconstruction. An algorithm determines the repeated patterns within this sample to extract the microcycles and the general macrocycle.
Trace Backup
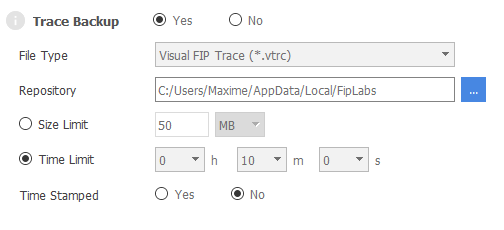
The Trace Backup frame is an option that allows you to save the FIP trace catched by the FipWatcher.
File Type
Two types of files are available for backup :
- Visual FIP Tace (*.vtrc)
This file format is human readable and exportable in a spreadsheet like Excel. This format is directly related to the choice you made in the Visual FIP Trace Depth option frame. Indeed, depending on the depth of analysis chosen, your file will be bigger or smaller and the behavior of the FIP network will not be fully saved.
- Raw FIP Packets (*.praw)
If you don't want to lose a crumb of your FIP scan, you can use this type of backup. However this format is not directly exportable. In order to make it readable later, you will need to use the File Conversion section to reformat it to * .vtrc format with the depth of analysis of your choice.
Repository
Trace backup folder.
Size Limit
This option is useful if you want to limit the size of your backup file. Once this limit is reached, the analysis will stop.
Time Limit
Similarly, if you want to control the scan time, you can use this option. Once this limit is reached, the analysis will stop.
Time Stamped
This option prefixes the name of the backup file with the date and the time of the start of the scan. This is useful to avoid overwriting old backups !
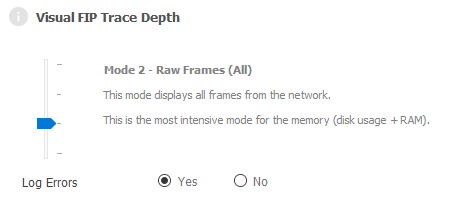
Visual FIP Trace Depth
No Data Mode
This mode doesn't display data. Only the statistical method of analysis is available. This is the most economical mode for the memory (disk usage + RAM). In this mode FIP Trace section will be empty as well as the possible vtrc backup file.
Raw Frames (All)
This mode displays all frames from the network. This is the most intensive mode for the memory (disk usage + RAM). Be careful though, this mode produces a very large vtrc file on the hard disk in a short time.
Raw Frames (Only on change)
This mode only displays the transactions when its useful data are changing. This mode is quite economical and efficient because it only displays data when an element changes over the FIP network without taking into account the continuous repetition of the FIP cycles.
Labels (Only on change)
This mode displays only the labels (mnemonics) value that changes. Using this mode, you can focus only on the data you are interested in and whose values are converted to be easily readable.
File Conversion - Praw To Vtrc
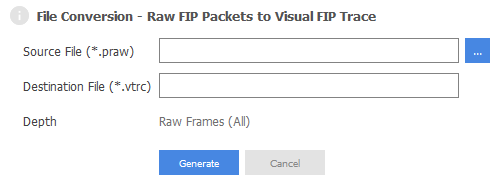
The File Conversion allows to convert a praw file to a vtrc file. This post-processing tool is useful for exploiting the raw file. It allows to regenerate the vtrc file you want. Be careful though, file conversion can take a long time.
Source File
Raw file source path.
Destination File
Vtrc file destination path.
Depth
Analysis depth selected for conversion.